atom06:Analysis
(→Map users activities) |
(→Map users activities) |
||
| Line 102: | Line 102: | ||
</gallery> | </gallery> | ||
| − | [https://docs.google.com/spreadsheet/ccc?key=0Ar5AYZD5l2EfdE9nM01FVjZTc3BQMncwaTRmUkpScEE&hl=en_US#gid=0 user groups and their activities and needs - table] | + | [https://docs.google.com/spreadsheet/ccc?key=0Ar5AYZD5l2EfdE9nM01FVjZTc3BQMncwaTRmUkpScEE&hl=en_US#gid=0 editable user groups and their activities and needs - table] |
==='''Map attractors'''=== | ==='''Map attractors'''=== | ||
Revision as of 13:20, 5 October 2011
Contents |
After an initial observation of the site, we carried out some analysis to understand the dynamics of our project's site. We used a double cognitive approach, conducting two main types of analysis: objective and subjective.
Objective Analyses
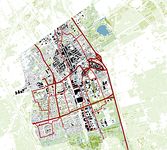
Morphological Analysis
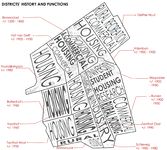
Districts' Hystory and Analysis
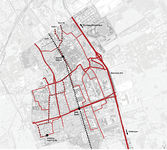
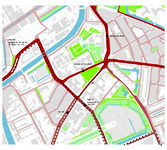
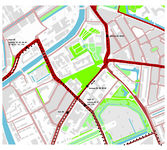
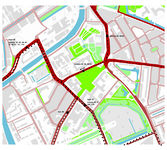
Traffic Analysis


current residents week days
current residents week days overall
current residents weekends
current residents weekends overall


the idea of mapping the current direct actors in the area is that we can decide on the importance of possible activities in the area at different times
figures are based on the most current statistical figures from the city of Delft regarding education and residents
Subjective Analyses
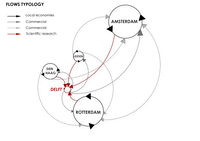
Flows' Typology Analysis
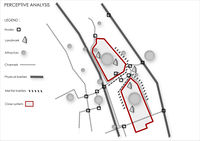
Perceptive Analysis


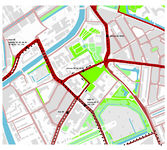
Green Spaces and Roads Configurations
We analyzed some possible configurations of expansion of green spaces in relation to roads.
Option 1 is to leave the boundaries as they are and work within the existing site. This means that the roads are there as a barrier.
Option 2 is to get rid of the Mijnbouwstraat and extend the park to the Botanical gardens and the Science Center. This will allow for functions that relate to the Science center to be effectively connected and creates the possibility for us to connect to the Botanical gardens, for which they already have a path leading to the Plantsoen.
Option 3 is to make the Julianalaan in front of the faculty of Architecture all park so the school connects better with the park and can really explore it's potential and connect with it for a new extension for it's need for space. The Botanical gardens and the Science Center will get even more traffic because of the 2-way traffic.
Option 4 is to only close off part of the Julianalaan, creating only part of the Mijnbouwstraat 2-way traffic, as per plans from the city council and creating a park that partly extends to the faculty of architecture.
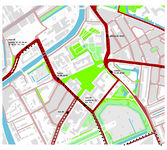
Option 5 is the 'radial' one where we close off both the Mijnbouwstraat and Julianalaan, redirecting traffic via the Zuidplantsoen behind the faculty of Architecture. This will create a space where the Science Center, the Botanical gardens, the faculty of Architecture and the roads beside the student housing at Michiel de Ruyterweg are bonded as one to create a large green space that (along with the botanical gardens) stretches all the way to the river de Schie. This would create a large usable park all involved parties, getting rid of the busy traffic and bond. Plus creating a green route for land traveling animals to get from the Schie to the cemetery and further.

Option 6 is the 'radical extreme' where we divert the traffic around the burial grounds via the main library and Aula. This one big green space would be a main focal point and park for the whole area. Parking is solved by underground parking or 'closed stacked parking' at certain points. Behind the Science Center, DUWO is already planning on building one, with the help of the Science Center. This could also be done at Bouwkunde to improve the connection with all the green. We really need to also consider the house at the point of the current park at the Poortlandplein as it blocks the entrance to the park. In some way this could also be a plus, creating an enclave.


Map users activities
- Map the users
- Map their current & possible activities
- Identify
- How to connect users
- Find matching activities
- Match the users by their activities / mix functions
- Connecting activities form the interaction and program
- The program (list of activities) is organised / mapped
Questions
- How does it change by the effect of users?
- How to map the users? Diagrammatically, with sensors etc.
Possible usergroups
- Students
- Residents
- Science center (workers, visitors, ...)
- Architecture department (tutors, personnel)
- Botanical garden
- Duwo
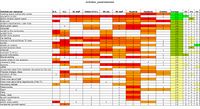
mapping of activities per user group, optimizing the site program
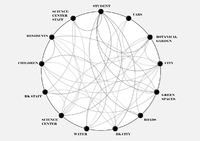
mapping of actor relations
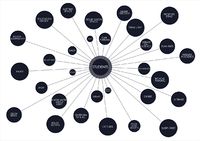
mapping of activities per user group


editable user groups and their activities and needs - table
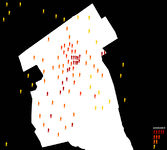
Map attractors
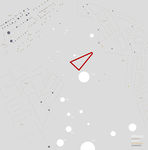
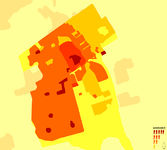
mapping the busy areas in Delft during the daytime throughout the week and the weekend shows us where there are good connection points for the possible metastasis objects to attract attention and real time connect to our center platform
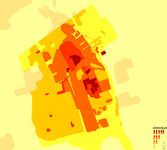
mapping of business in Delft during regular weekday daytime.
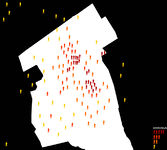
mapping of business in Delft during weekend daytime.


Conclusions
The analysis reveals that our site is an in-between space among two system that don't cooperate and interact: City system - Tu system. Our desire is that these two systems get more integrated and start to actively communicate and interact. We and some of the residents we interviewed feel this is needed to make the city unified again.