atom06:Concept
| Line 19: | Line 19: | ||
==='''Analyze spatial ability'''=== | ==='''Analyze spatial ability'''=== | ||
| − | <gallery widths="200" heights="150" perrow=" | + | <gallery widths="200" heights="150" perrow="4" > |
Image:systems' movements merge copia.jpg|'''Systems' Movements''' | Image:systems' movements merge copia.jpg|'''Systems' Movements''' | ||
| Line 26: | Line 26: | ||
Image:layers' program merge copia.jpg|'''Layers' Program''' | Image:layers' program merge copia.jpg|'''Layers' Program''' | ||
| + | |||
| + | Image:Spatial relationship and organization merge copia.jpg|'''Spatial Relationship''' | ||
</gallery> | </gallery> | ||
Revision as of 16:46, 25 September 2011
Contents |
Intervention
Our idea is to create a network that connects in real-time our site with the rest of Delft. From the center of this network, like in metastasis, things spread from the center to non-adjacent parts; contaminating all the city. Metastasis means "displacement" in Greek, from μετά, meta, "next", and στάσις, stasis, "placement".
In practise, our project is divided in two main parts. The center, that is a main public platform that attracts people from different user groups to our site (which is the center between the TU and the city center) where they can interact and communicate; and the metastasis, that are urban located interactive stations that relate back to the center and reverse.
Work in Progress
To define the strategy we are doing analysis on different topics: map the activities of users to understand what can stimulate interaction and communication; investigate the possible system's spatial ability; analyze the flow of people to determine the attractors place in which to place the metastases.
Analyze spatial ability
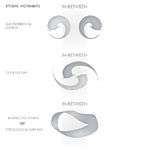
Systems' Movements
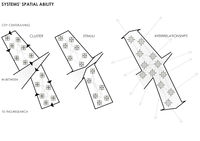
Spatial Ability
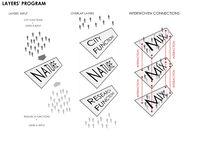
Layers' Program
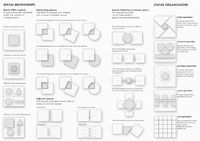
Spatial Relationship


Map users activities
- Map the users
- Map their current & possible activities
- Identify
- How to connect users
- Find matching activities
- Match the users by their activities / mix functions
- Connecting activities form the interaction and program
- The program (list of activities) is organised / mapped
Questions
- How does it change by the effect of users?
- How to map the users? Diagrammatically, with sensors etc.
Possible usergroups
- Students
- Residents
- Science center (workers, visitors, ...)
- Architecture department (tutors, personnel)
- Botanical garden
- Duwo
user groups and their activities and needs - table