atom06:Network
Contents |
Network Analysis
Conceptual Analysis
Comparison of geolocated Wikipedia articles in five different languages (EN, FI, FR, IT, NL). This is a graphical presentation of what is considered important or interested enough to have a Wikipedia article of the subject. The same analysis was repeated on three different level.
- Delft and surroundings, including The Hague and Rotterdam
- Delft city: old center and TU campus area
- Immediate surroundings of Vries van de Hoyst park

ZOOM 1

ZOOM 2

ZOOM 3
It is easy to notice, that in different languages there are different points of interest. In dutch there are much more marked places than in any other language. The Vries van de Heyst park is not noted in any of the languges. There seems to be almost no virtual presence of the park, even it is a protected based on it's historical and landscaping qualitis.
Map users activities
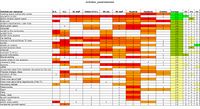
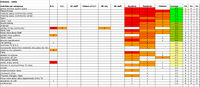
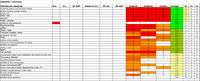
editable user groups and their activities and needs - table
on the basis of this table possible activities can be identified for the various users surrounding out site.
mapping of activities per user group, finding similarities
mapping of actor relations - week evenings
mapping of actor relations - weekends and holidays


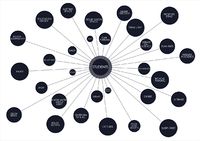
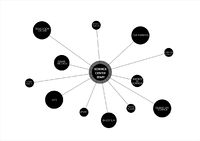
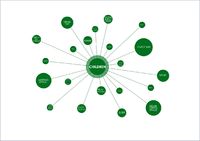
Activities of the user groups
The following diagrams illustrate the current activities of our potential users and their relationship/connections with each other.
On the second diagram, we introduced possible programs of the site to see how these occupations could be connected and redistributed on and beyond our location.
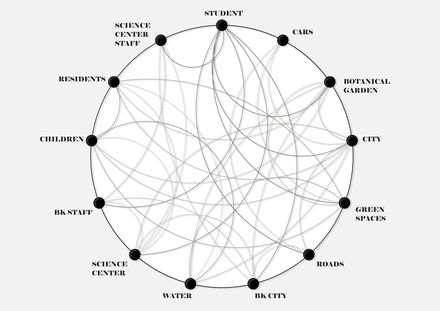
mapping of actor relations
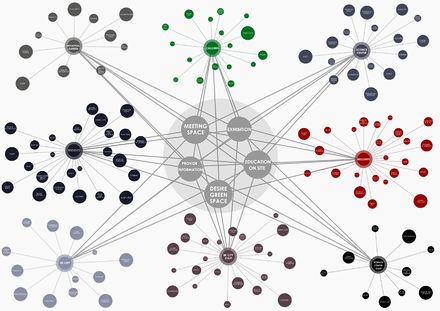
mapping of actor relations


students
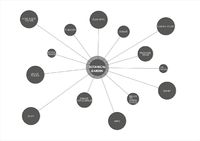
botanical gardens
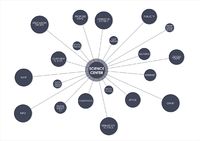
science Center
science center staff
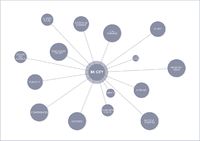
bk city
bk city staff
residents
children


Map user displacement
mapping user movements shows how space is being used by what mode of transportation.
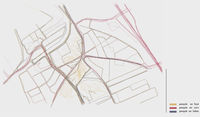
mapping of user movements during the day
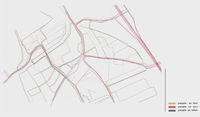
mapping of user movements during the night


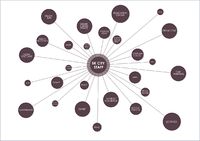
Map city attractor points
mapping the busy areas in Delft during the daytime throughout the week and the weekend shows us where there are good connection points for the possible metastasis objects to attract attention and real time connect to our center platform
mapping of business in Delft during the week.
mapping of business in Delft during the weekend.


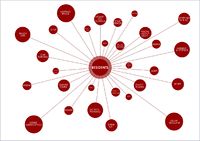
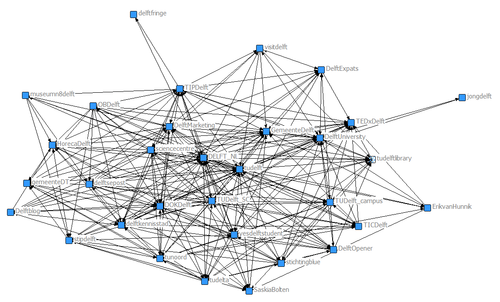
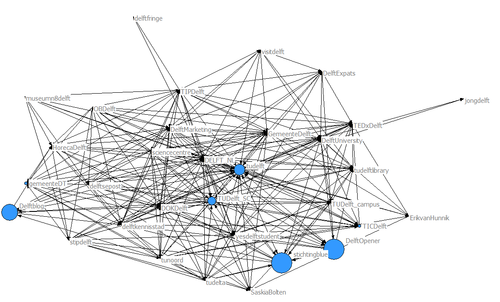
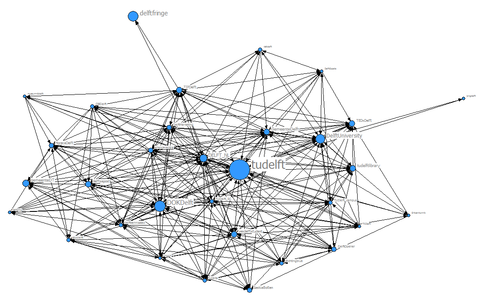
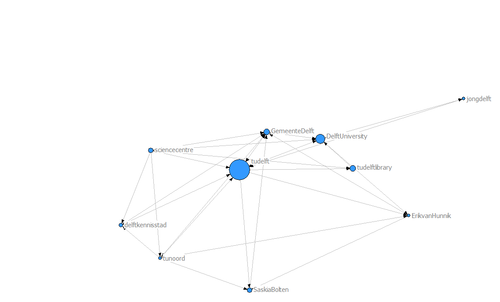
Network visualization of the Delft area trough Twitter
This diagrams hightlights the minimalistic existance of a virtual network around the site.
Delft Tweet Data base
Data

Network visualisations
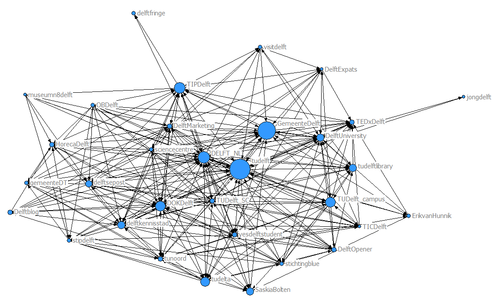
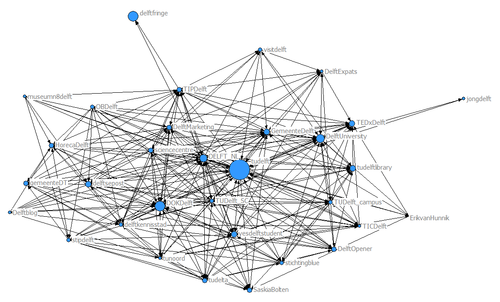
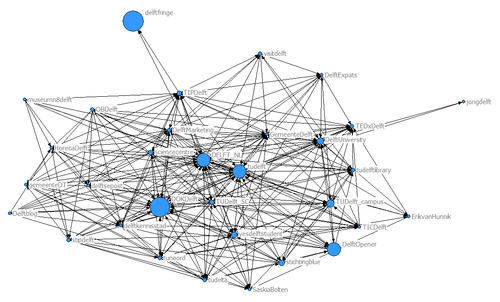
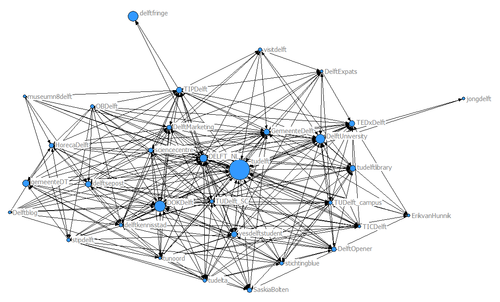
Ego centric visualisations


Multiple centers

